Power BI interviews are getting tougher—and advanced DAX skills often make the difference between a good analyst and a standout one. If you’ve ever stumbled over CALCULATE filters or second-guessed your use of SUMMARIZE, you’re not alone.
That’s why we’ve put together this in-depth guide to the most challenging Power BI DAX interview questions for experienced professionals. You’ll explore advanced functions, table manipulation techniques, and performance optimization strategies—complete with practical examples to help you apply these concepts with confidence and precision.

Mastering Complex DAX Functions for Advanced Analytics
Power BI DAX language empowers users to create sophisticated calculations and data models. Advanced DAX functions can significantly boost a data analyst’s career prospects. Let’s explore some of the most complex DAX functions and their real-world applications.
Unleashing the Power of CALCULATE
The CALCULATE function in Power BI DAX modifies the filter context of a calculation, unlocking a wide range of possibilities for dynamic reporting. As a core component of Power BI DAX, CALCULATE enables you to compare sales across different time periods or product categories simultaneously. Here’s a practical example:
Sales YoY Growth = CALCULATE(SUM(Sales[Amount]), SAMEPERIODLASTYEAR(DimDate[Date]))/ SUM(Sales[Amount]) – 1
This measure calculates year-over-year sales growth, an essential metric for any business analysis.
Time Intelligence: Your Secret Weapon
Time intelligence functions in DAX transform financial and sales analysis. DATEADD, PARALLELPERIOD, and SAMEPERIODLASTYEAR are particularly powerful. For example, DATEADD creates a rolling 3-month average:
Rolling 3M Avg = AVERAGEX( DATESINPERIOD( DimDate[Date], LASTDATE(DimDate[Date]),
-3, MONTH),[Total Sales]
This measure provides a smoothed trend line, helping to identify underlying patterns in your data.
FILTER vs. CALCULATETABLE: Choosing the Right Tool
FILTER and CALCULATETABLE serve different purposes in creating table expressions. FILTER applies complex filtering logic more efficiently. CALCULATETABLE changes the filter context of an entire table.
To find the top 5 products by sales:
Top 5 Products = CALCULATETABLE( TOPN(5, Products, [Total Sales]), ALL(Products))
This expression uses CALCULATETABLE to remove existing filters on the Products table before applying the TOPN function.
Practical Applications in Business Intelligence
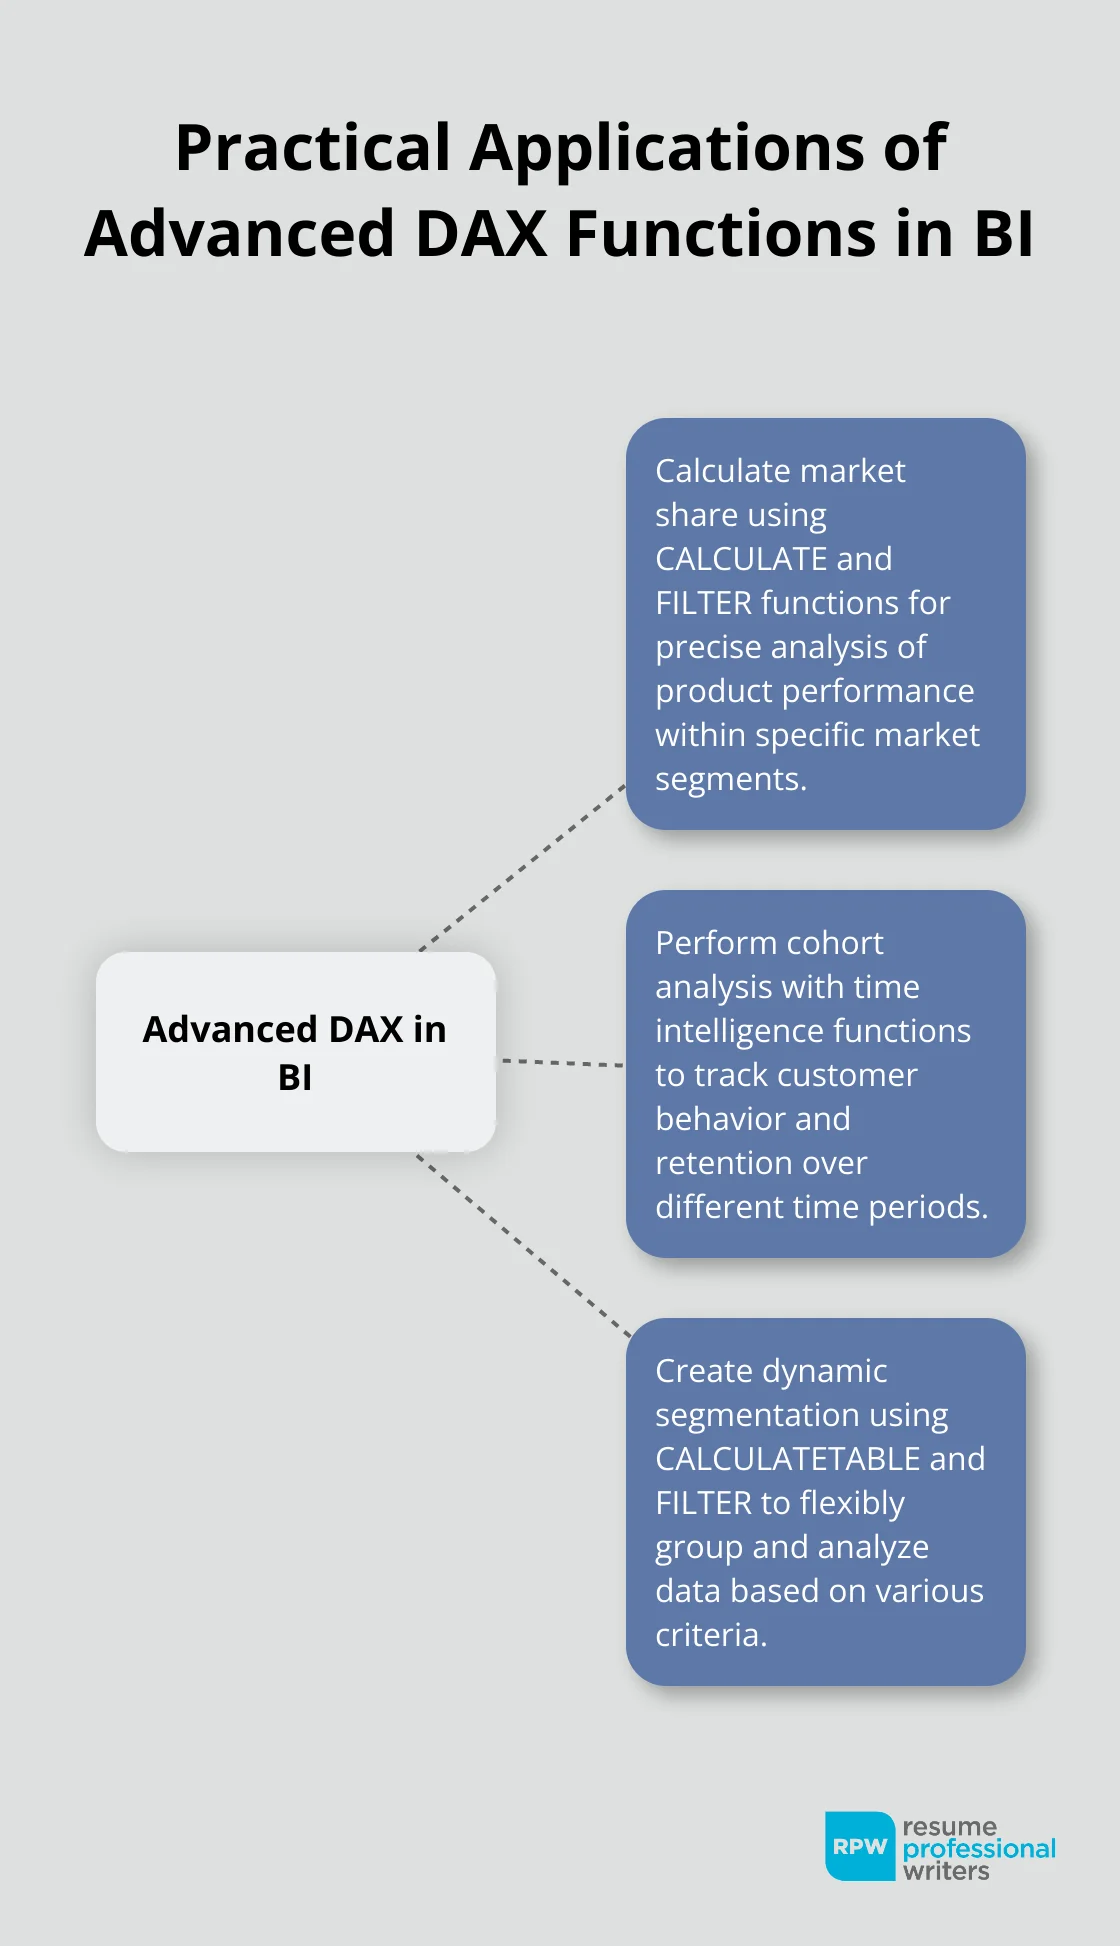
Advanced DAX functions solve real-world business problems. For instance, you can use these functions to:
- Calculate market share (using CALCULATE and FILTER)
- Perform cohort analysis (using time intelligence functions)
- Create dynamic segmentation (using CALCULATETABLE and FILTER)
These applications demonstrate the versatility of DAX in addressing complex analytical challenges.
Continuous Learning and Skill Development
The field of data analytics evolves rapidly, and DAX is no exception. Try to stay updated with the latest DAX features and best practices. Experiment with these functions in your Power BI projects to truly internalize their power and versatility.
As we move forward, let’s explore how these advanced DAX functions can be applied to manipulate tables and perform complex aggregations, further enhancing your data modeling capabilities.
Mastering Advanced Table Manipulation in DAX
Power BI’s DAX language offers powerful tools for complex table manipulations, enabling data analysts to perform sophisticated operations on their datasets. These techniques can significantly enhance a professional’s data modeling capabilities and career prospects.
SUMMARIZE: Multi-Dimensional Analysis Made Easy
SUMMARIZE groups data and applies aggregations, making it ideal for creating summary tables. Here’s an example to analyze sales performance across multiple dimensions:
Sales_Summary = SUMMARIZE( Sales, Product[Category], Customer[Region], “Total Sales”, SUM(Sales[Amount]), “Avg Order Value”, AVERAGE(Sales[Amount]))
This expression creates a summary table showing total sales and average order value for each product category and customer region, providing a multi-dimensional view of sales performance.
CROSSJOIN and GENERATEALL: Scenario Analysis Unleashed
CROSSJOIN and GENERATEALL create Cartesian products, useful in scenario analysis and forecasting. To generate a table of all possible combinations of products and dates for the next year:
Future_Scenarios = GENERATEALL( CROSSJOIN( VALUES(Product[Name]), CALENDARAUTO(12) ), “Projected Sales”, RAND() * 1000)
This creates a table with every product for each day of the next year, with a random projected sales value. Such tables prove invaluable for what-if analyses and sales forecasting.
UNION and INTERSECT: Set Operations for Advanced Segmentation
UNION and INTERSECT allow for sophisticated set operations, essential for comparing different segments of your data. To identify high-value customers who have purchased across multiple product categories:
High_Value_CrossCategory = INTERSECT( FILTER(Customer, [Total Spend] > 10000), FILTER(Customer, [Distinct Categories] > 2))
This expression finds the intersection of high-spending customers and those who’ve bought from multiple categories, helping target cross-selling campaigns.
Practical Applications in Business Intelligence
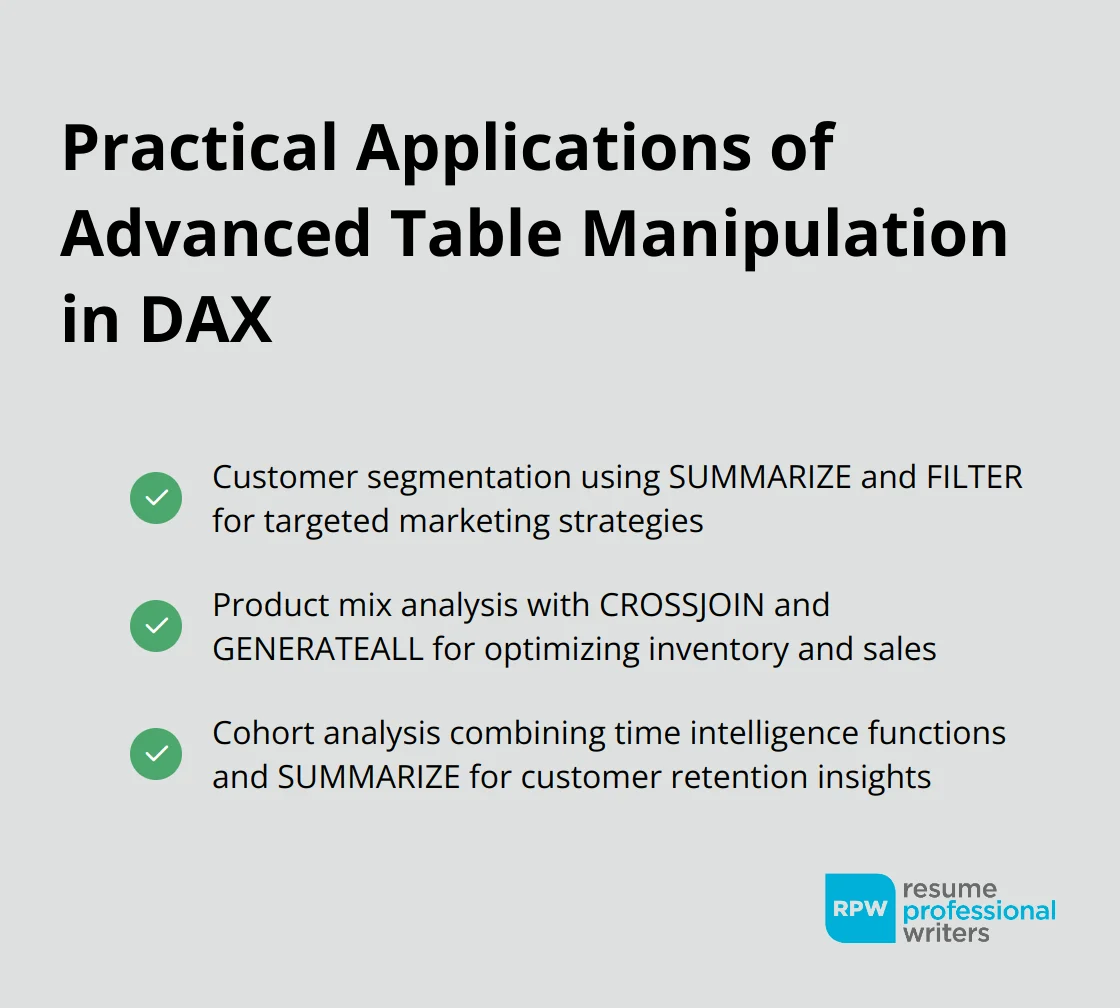
Advanced table manipulation techniques in BI DAX open up new possibilities for data analysis and reporting. Data professionals can create more dynamic and insightful Power BI reports by mastering these functions. Some practical applications include:
- Customer segmentation (using SUMMARIZE and FILTER)
- Product mix analysis (using CROSSJOIN and GENERATEALL)
- Cohort analysis (using time intelligence functions and SUMMARIZE)
These advanced table manipulation techniques form the foundation for complex data modeling and analysis. The next section will explore how to optimize DAX performance, ensuring that these sophisticated calculations run efficiently in your Power BI reports.
Turbocharging Power BI DAX Performance
Performance optimization forms the cornerstone of efficient and responsive Power BI reports. Let’s explore how to supercharge your DAX queries for maximum performance.
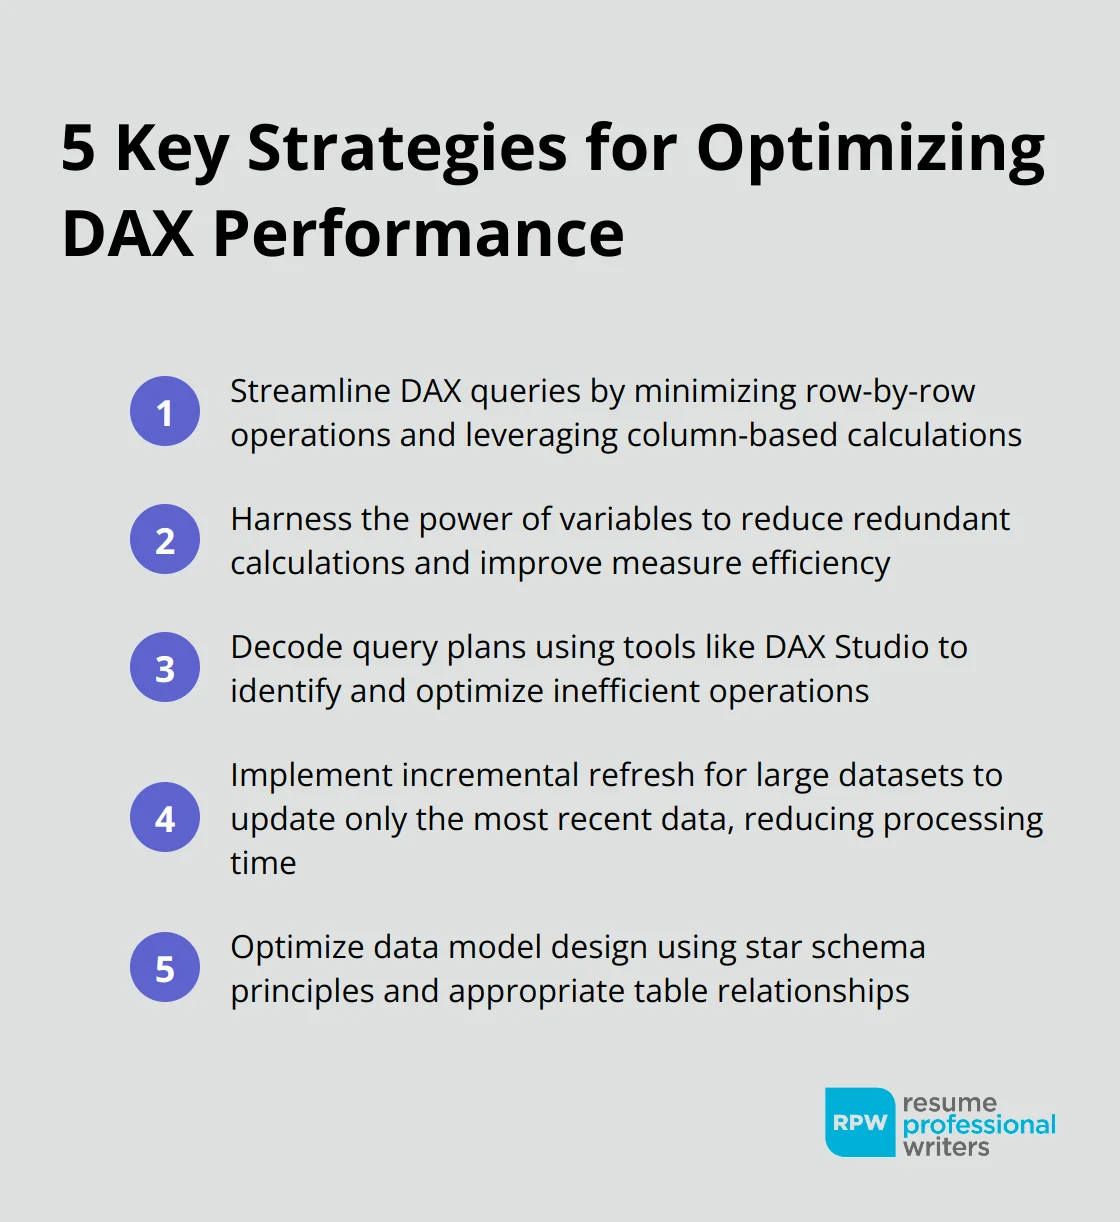
Streamline DAX Queries
Efficient DAX queries power high-performing Power BI reports. Minimize row-by-row operations, which can slow down calculations. Instead, use DAX’s ability to work with entire columns at once. For example, replace:
BadMeasure = SUMX(Sales, IF(Sales[Amount] > 1000, Sales[Amount], 0))
With:
GoodMeasure = SUMX(FILTER(Sales, Sales[Amount] > 1000), Sales[Amount])
This approach reduces the number of operations DAX performs, resulting in faster query execution.
Harness the Power of Variables
Variables in DAX improve performance by reducing redundant calculations. They allow you to store intermediate results and reuse them throughout your measure. Consider this example:
Total Sales with Tax = VAR BaseSales = SUM(Sales[Amount])VAR TaxRate = 0.08RETURN BaseSales * (1 + TaxRate)
Using variables ensures that BaseSales is calculated only once, even if it’s used multiple times in more complex measures.
Decode Query Plans for Optimization
Understanding how Power BI executes your DAX queries is key to optimization. Use DAX Studio (a free tool for DAX query analysis) to examine query plans. Look for full table scans, which can indicate inefficient filtering. Optimize these by adding calculated columns or adjusting your data model.
If you frequently filter by date ranges, add a Date table with pre-calculated periods. This allows Power BI to use more efficient filter propagation techniques.
Implement Incremental Refresh
For large datasets, implement incremental refresh to update only the most recent data. This reduces processing time and resource usage. Set up partitions in your data model and define refresh policies based on date ranges or other criteria.
Optimize Data Model Design
A well-designed data model enhances query performance. Use star schema design principles, create appropriate relationships between tables, and avoid unnecessary complexity. Denormalize dimension tables where appropriate to reduce the need for complex joins in your DAX formulas.
From Proficient to Powerful: What’s Next in Your DAX Journey
Advanced Power BI DAX skills are more than just technical know-how—they’re key differentiators in the data analytics field. Mastery of functions like CALCULATE, SUMMARIZE, and advanced filtering techniques allows professionals to build dynamic, high-performing reports that drive smarter business decisions.
To stay competitive, embrace continuous learning through official resources, community engagement, and hands-on practice. Most importantly, focus on real-world application—being able to explain how you’ve used complex DAX solutions to solve actual problems will set you apart in interviews and on the job.
In the end, those who invest in refining their Power BI and DAX expertise position themselves as indispensable assets in any data-driven organization.
Land Your Target Role as a Data Professional with Resume Professional Writers
Mastering advanced Power BI DAX concepts, such as CALCULATE, SUMMARIZE, and performance optimization, can significantly elevate your capabilities as a data professional. As the demand for skilled analytics experts continues to grow, being able to demonstrate your hands-on experience with complex DAX functions and real-world problem-solving gives you a competitive edge in interviews and on the job. While these technical skills are essential, your resume also plays a crucial role in making a lasting impression.
To bridge that gap between expertise and opportunity, Resume Professional Writers is here to help. We specialize in crafting keyword-optimized resumes that showcase your technical strengths, career achievements, and industry value. Our team understands what employers in the data analytics field are looking for—and we know how to position your skills for maximum impact. Let us help you turn your Power BI and DAX proficiency into job-winning results.